My 2016 Fringe: By The Numbers – Vancouver Edition
Hello!
Every (2013) single (2014) year (2015), I put out a blog post with financial breakdowns of my fringe festival experiences. This summer, however, I took a break from the tour as a whole and only performed in Vancouver.
Before I get started, I just want to give Vancouver Fringe kudos for making the ticket costs more transparent this year, at least online, clearly separating the amount of each ticket price that is given to the performer versus the fringe festival fee attached to each ticket.
This year (2016), Vancouver Fringe had 100 shows – more than ever before, but fewer than the advertised number of 110 due to ‘Generation HOT’ and special event shows – and gave $260,213.00 in revenues to artists.
Divide that number by the number of shows, and the average revenue per company would be 2,602.13$ . Given how successful many companies are, it’s safe to peg the median revenue figure somewhere lower than that.
(thanks to Shantini Klaassen for getting these numbers to me.)
So let’s take a look at how I did compared to the average!:
Vancouver audience numbers (for William vs The World):
# of performances: 9
BYOV Venue capacity (Arts Umbrella): 31
Total # of audience members: 10 + 30 + 23 + 24 + 23 + 13 + 15 + 30 + 29 = 197.
Average # of audience members per show: 21.8
Total # of paying audience members: 4 + 17 + 15 + 20 + 13 + 10 + 8 + 18 + 19 = 124.
Average # of paying audience members per show: 13.78
Comp ticket breakdown:
# of Kids Up Front ticket donation: 12
(I gave four comp tickets to each of my first three shows to https://www.kidsupfrontvancouver.com/ , a charity that Vancouver Fringe partners with.)
# of Super Pass comps (given to those who billet artists – let artists stay with them): 1
# of Exchange Vouchers (another option for those who billet artists): 1
# of Kick Ass Pass comps (free fringing given out by the festival to staff and big donors): 3
# of Artist Request comps: 5
(I had a few friends arrive late to one show so I booked them comps for another, and I traded show tickets with another friend.)
# of ‘Comp-Advance’ (any comps booked in advance): 17
# of volunteer/artist rush comps (Vancouver Fringe has an awesome rush line system where volunteers and other artists can see non-sold-out shows for free): 34

EXPENSES:
Failed Fringe Application fees:
Saskatoon: -50.00$ (actually got in, but had to drop out.)
Orlando: -33.43$
Winnipeg: -25.00$
CAFF (Canadian Association of Fringe Festivals lottery): -25.00$
San Diego: -56.99$ (got in, but dropped due to potential border issues due to citizenship problems)
Nanaimo: -25.00$
TOTAL: -215.42$
Vancouver Fringe fees:
Lottery draw (did not get in): -50.00$
Vancouver Fringe BYOV fee: -450.00$
Arts Umbrella venue fee: -500.00$
Arts Umbrella-required extra venue insurance: -43.75$ (+time to find insurance broker)
TOTAL: -1043.75$
Other:
Photoshoot: 0$ (reused content from previous year.)
Packing tape for posters: -3.55$
25 Posters from Clubcard: -12.26$
1000 postcard handbills from ePrintFast: -75.28$
Chuck the Third (cactus prop/character): -8.95$
TOTAL: -100.04$
TOTAL EXPENSES:
-1359.21$
Expenses not included:
Fringe bar beers (5?): Roughly -27.50$
– Rent paid (as I live here)
– Food eaten
– Lost income from not working dayjobs (although during the festival I DID admittedly work one Science World shift, one SFU-Woodwards front of house shift, and put in a few hours on Richmond Arts Coalition items in my role there as Administrative Assistant.)
INCOME:
Vancouver Fringe:
Frequent Fringer 4: 10$ per ticket = 0$ to the festival, 10$ to the artist.
Frequent Fringer 10 or 30: 9$ per ticket = 0$ to the festival, 9$ to the artist.
Full ticket price: 14$ = 3$ to the festival, 11$ to the artist.
# of Frequent Fringer 4 tickets sold: 5 tickets :: at 10$ per ticket = 50.00$
# of Frequent Fringer 10 + 30 tickets sold: 29 tickets :: at 9$ per ticket = 261.00$
# of full tickets sold: 90 tickets sold = 990.00$
Average amount per ticket, paid to the artist: 10.49$
Total: +1301.00$
FINAL FINANCIAL VERDICT: 1301.00$ – 1359.21$ = -58.21
Compare to 2015’s +897.63$ (due to fee for writing TITUS)
Compare to 2014’s +83.51$
Compare to 2013’s -1671.16$
Conclusion:
William vs The World is a harder show to sell than The Most Honest Man In The World, and I didn’t have any other festivals this year to build any sort of momentum or media push, so I expected a smaller turnout, and that happened. All the same, the only reason the number was negative this year was due to festival fees for festivals I ended up not getting into or dropping out of, so I’m content. It was a lot of fun to get to be a part of at least one fringe this year.
Felt like home.

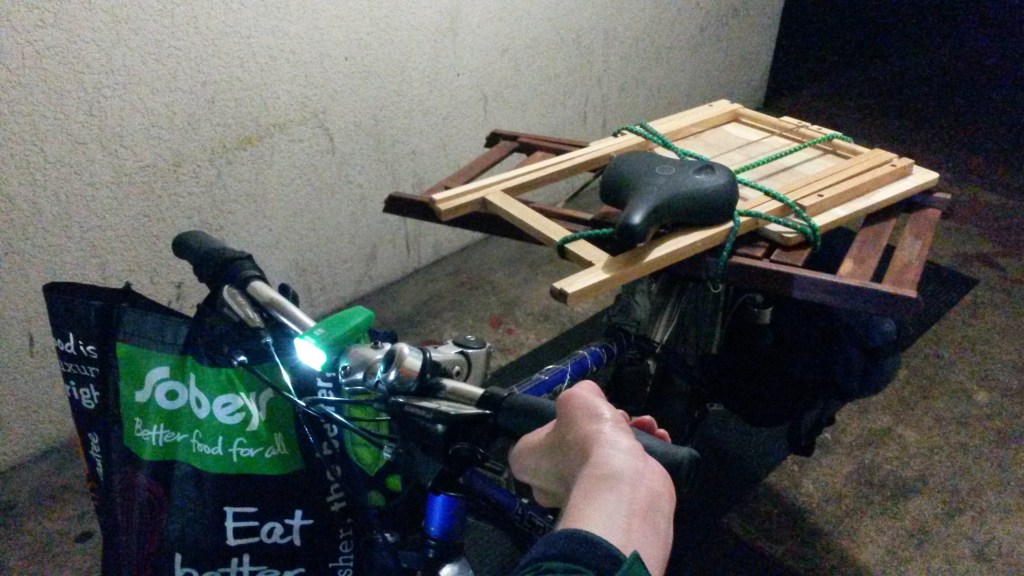
And a final image of how I transported my set to and from Granville Island. 🙂


Leave a comment